14 Dec Aurora Saturday 14:30 Python Practice 22.12.10.
 Question 1(Graph/Floyd):
Consider yourself lucky! Consider yourself lucky to be still breathing and having fun participating in this contest. But we apprehend that many of your descendants may not have this luxury. For, as you know, we are the dwellers of one of the most polluted cities on earth. Pollution is everywhere, both in the environment and in society and our lack of consciousness is simply aggravating the situation.
However, for the time being, we will consider only one type of pollution – the sound pollution. The loudness or intensity level of sound is usually measured in decibels and sound having intensity level 130 decibels or higher is considered painful. The intensity level of normal conversation is 6065 decibels and that of heavy traffic is 7080 decibels.
Consider the following city map where the edges refer to streets and the nodes refer to crossings. The integer on each edge is the average intensity level of sound (in decibels) in the corresponding street.
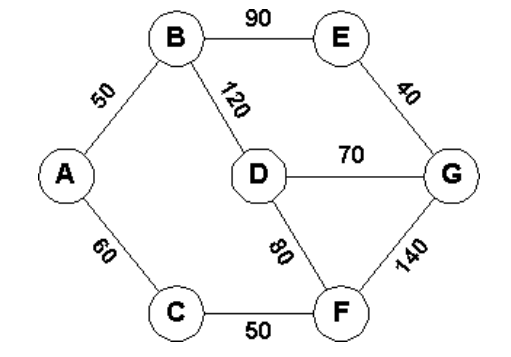
To get from crossing A to crossing G you may follow the following path: A-C-F-G. In that case you must be capable of tolerating sound intensity as high as 140 decibels. For the paths A-B-E-G, A-B-D-G and A-C-F-D-G you must tolerate respectively 90, 120 and 80 decibels of sound intensity.
There are other paths, too. However, it is clear that A-C-F-D-G is the most comfortable path since
it does not demand you to tolerate more than 80 decibels.
In this problem, given a city map you are required to determine the minimum sound intensity level
you must be able to tolerate in order to get from a given crossing to another.
Input
The input may contain multiple test cases.
The first line of each test case contains three integers C(≤ 100), S(≤ 1000) and Q(≤ 10000) where
C indicates the number of crossings (crossings are numbered using distinct integers ranging from 1 to
C), S represents the number of streets and Q is the number of queries.
Each of the next S lines contains three integers: c1, c2 and d indicating that the average sound
intensity level on the street connecting the crossings c1 and c2 (c1 ̸= c2) is d decibels.
Each of the next Q lines contains two integers c1 and c2 (c1 ̸= c2) asking for the minimum sound
intensity level you must be able to tolerate in order to get from crossing c1 to crossing c2.
The input will terminate with three zeros form C, S and Q.
Output
For each test case in the input first output the test case number (starting from 1) as shown in the
sample output. Then for each query in the input print a line giving the minimum sound intensity level
(in decibels) you must be able to tolerate in order to get from the first to the second crossing in the
query. If there exists no path between them just print the line “no path”.
Print a blank line between two consecutive test cases.
Sample Input
7 9 3
1 2 50
1 3 60
2 4 120
2 5 90
3 6 50
4 6 80
4 7 70
5 7 40
6 7 140
1 7
2 6
6 2
7 6 3
1 2 50
1 3 60
2 4 120
3 6 50
4 6 80
5 7 40
7 5
1 7
2 4
0 0 0

Sample Output
Case #1
80
60
60

Case #2
40
no path
80
Question 2:
Frank is a portfolio manager of a closed-end fund. Fund collects money (cash) from individual investors for a certain period of time and invests cash into various securities in accordance with fund’s investment strategy. At the end of the period all assets are sold out and cash is distributed among individual investors of the fund proportionally to their share of original investment.
Frank manages equity fund that invests money into stock market. His strategy is explained below. Frank’s fund has collected c US Dollars (USD) from individual investors to manage them for m days. Management is performed on a day by day basis. Frank has selected n stocks to invest into. Depending on the overall price range and availability of each stock, a lot size was chosen for each stock — the number of shares of the stock Frank can buy or sell per day without affecting the market too much by his trades. So, if the price of the stock is pi USD per share and the lot size of the corresponding stock is si, then Frank can spend pisi USD to buy one lot of the corresponding stock for his fund if the fund has enough cash left, thus decreasing available cash in the fund. This trade is completely performed in one day.
When price of the stock changes to p′i later, then Frank can sell this lot for p′isi USD, thus increasing available cash for further trading. This trade is also completely performed in one day. All lots of stocks that are held by the fund must be sold by the end of the fund’s period, so that at the end (like at the beginning) the fund is holding only cash.
Each stock has its own volatility and risks, so to minimize the overall risk of the fund, for each stock there is the maximum number of lots ki that can be held by the fund at any given day. There is also the overall limit k on the number of lots of all stocks that the fund can hold at any given day.
Any trade to buy or sell one lot of stock completely occupies Frank’s day, and thus he can perform at most one such trade per day. Frank is not allowed to buy partial lots if there is not enough cash in the fund for a whole lot at the time of purchase.
Now, when fund’s period has ended, Frank wants to know what is the maximum profit he could have made with this strategy having known the prices of each stock in advance. Your task is to write a program to find it out.
It is assumed that there is a single price for each stock for each day that Frank could have bought or sold shares of the stock at. Any overheads such as fees and commissions are ignored, and thus cash spent to buy or gained on a sell of one lot of stock is exactly equal to its price on this day multiplied by the number of shares in a lot.
Input
Input consists on several datasets. The first line of each dataset contains four numbers — c, m, n, and k. Here c (0.01 ≤ c ≤ 100000000.00) is the amount of cash collected from individual investors up to a cent (up to two digits after decimal point); m (1 ≤ m ≤ 100) is the number of days in the fund’s lifetime; n (1 ≤ n ≤ 8) is the number of stocks selected by Frank for trading; k (1 ≤ k ≤ 8) is the overall limit on the number of lots the fund can hold at any time.
The following 2n lines describe stocks and their prices with two lines per stock.
The first line for each stock contains the stock name followed by two integer numbers si and ki.
Here si (1 ≤ si ≤ 1000000) is the lot size of the given stock, and ki (1 ≤ ki ≤ k) is the number of lots of this stock the fund can hold at any time. Stock name consists of 1 to 5 capital Latin letters from ‘A’ to ‘Z’. All stock names in the input file are distinct.
The second line for each stock contains m decimal numbers separated by spaces that denote prices of the corresponding stock for each day in the fund’s lifetime. Stock prices are in range from 0.01 to 999.99 (inclusive) given up to a cent (up to two digits after decimal point).
Cash and prices in the input file are formatted as a string of decimal digits, optionally followed by a dot with one or two digits after a dot.
Output
For each dataset, write to the output file m + 1 lines. Print a blank line between datasets.
On the first line write a single decimal number — the precise value for the maximal amount of cash that can be collected in the fund by the end of its period. The answer will not exceed 1 000 000 000.00.
Cash must be formatted as a string of decimal digits, optionally followed by a dot with one or two digits after a dot.
On the following m lines write the description of Frank’s actions for each day that he should have made in order to realize this profit. Write ‘BUY’ followed by a space and a stock name for buying a stock. Write ‘SELL’ followed by a space and a stock name for selling a stock. Write ‘HOLD’ if nothing should have been done on that day.
Sample Input
144624.00 9 5 3
IBM 500 3
97.27 98.31 97.42 98.9 100.07 98.89 98.65 99.34 100.82
GOOG 100 1
467.59 483.26 487.19 483.58 485.5 489.46 499.72 505 504.28
JAVA 1000 2
5.54 5.69 5.6 5.65 5.73 6 6.14 6.06 6.06
MSFT 250 1
29.86 29.81 29.64 29.93 29.96 29.66 30.7 31.21 31.16
ORCL 300 3
17.51 17.68 17.64 17.86 17.82 17.77 17.39 17.5 17.3

Sample Output
151205.00
BUY GOOG
BUY IBM
BUY IBM
HOLD
SELL IBM
BUY MSFT
SELL MSFT
SELL GOOG
SELL IBM
Sorry, the comment form is closed at this time.